


 14 / 16

S P R I N G / S U M M E R 2 0 1 7
14
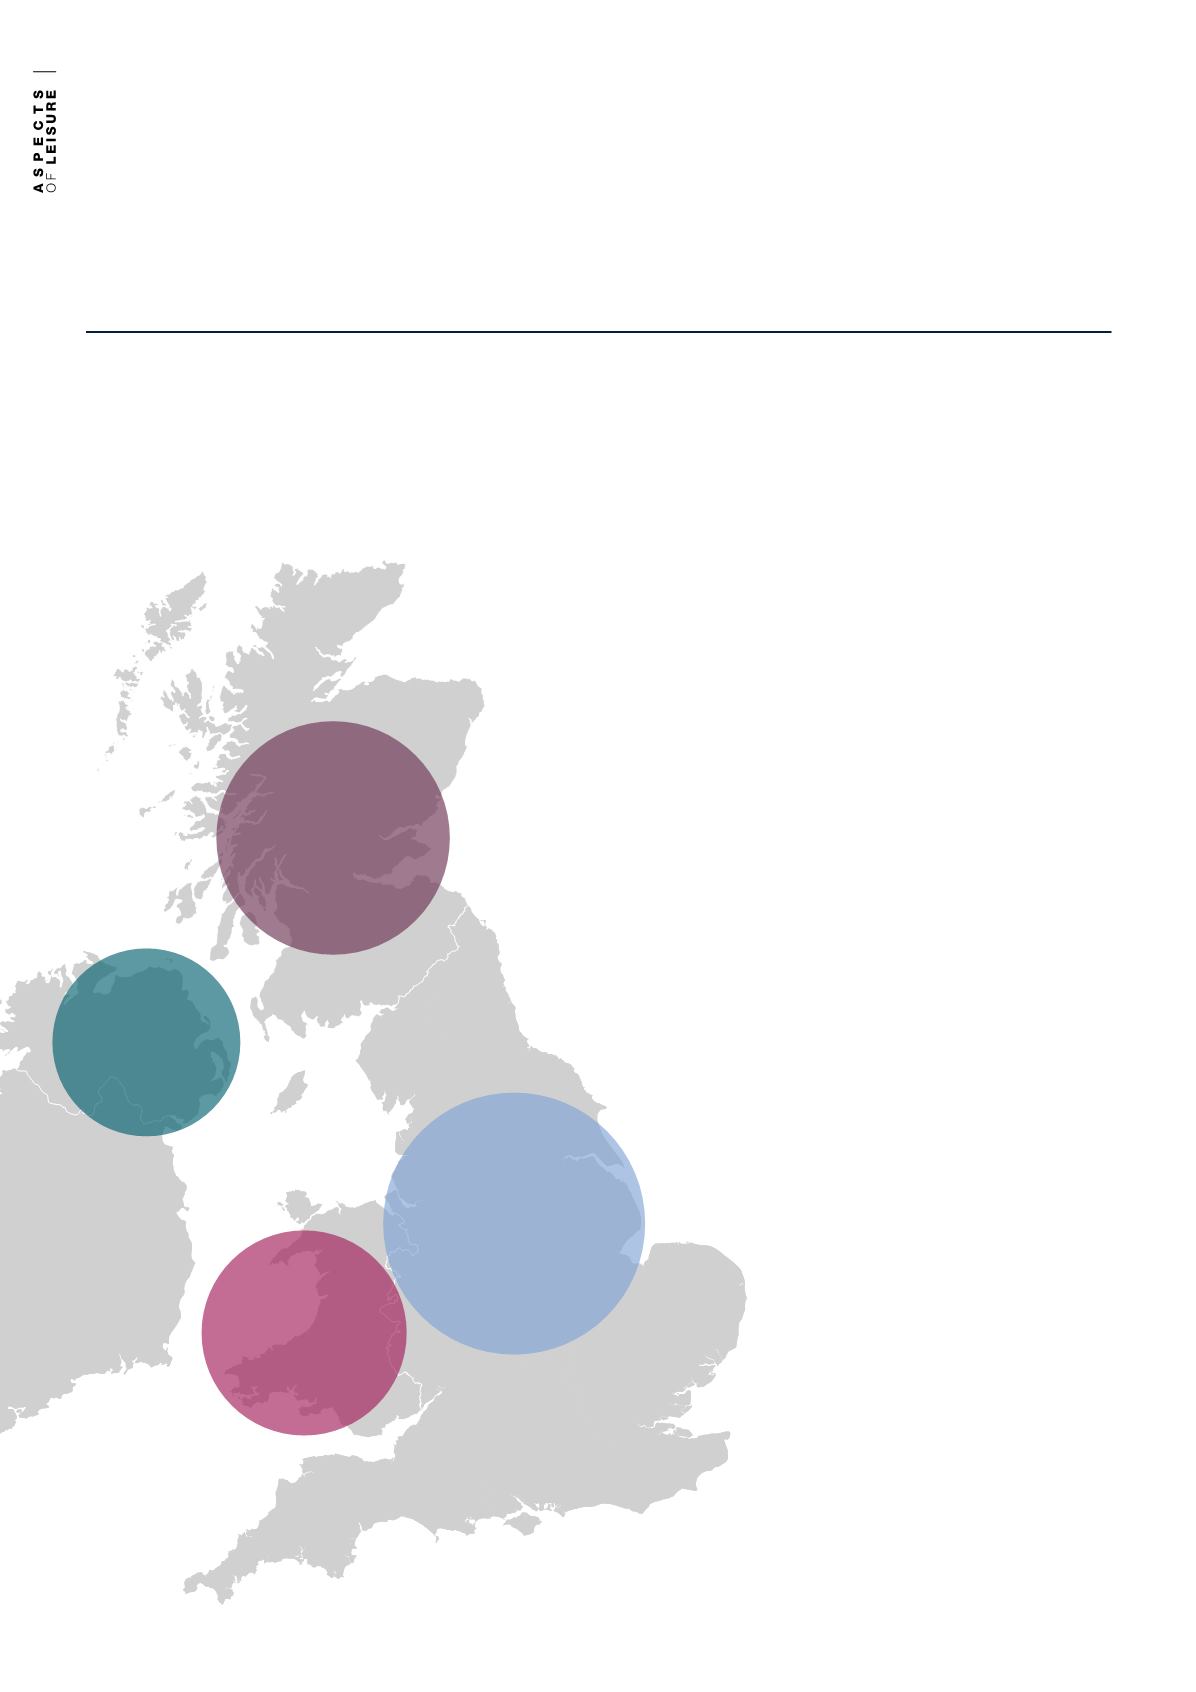
1.56bn
Visitor Spend
in Scotland
14.45 bn
Visitor Spend
in England
182m
Visitor Spend in
Northern Ireland
366m
Visitor Spend
in Wales
INCREASED SPEND
Overall spend varied by quarter and region as shown
on the map. Visit England, Wales and Scotland all
showed increased spend for 2016 for day visits. With
interest rates remaining at an all time low, a beneficial
exchange rate for foreign visitors with a weak pound and
a continued ‘staycation’ effect following on from foreign
terror alerts, more discretionary spend from both home
and abroad went into UK tourist attractions last year.
Taking the countryside, historic towns, churches, galleries
and museums into consideration, there are a large number
of free attractions available. For attractions requiring
income, capturing visitor spend can often entail diversifying
the visitor offering and ensuring every opportunity for food,
drink and retail spend is capitalised on. The offer must
be regularly renewed or added to, to maintain customer
interest and good value for money in the eyes of the visitor.
A ‘season’ or annual ticket is an increasingly used trend
to secure higher entry fees initially and lead to repeat
visits and secondary spend over the year, which visitors
might otherwise have been reluctant to undertake.
INCREASED VISITOR NUMBERS
Statistics also showed that visitor numbers were up 4%
in the year ending January 2017 compared to the same
period ending January 2016. London tourism statistics
however sadly showed the effects of terror fears with
barely registered growth, contrary to national venues.
Both the weather and major events have been shown to
affect visitor numbers.
This year with no major sporting events which have
previously been shown to disrupt tourism such as the
Olympics, or the World Cup, and with short-lived political
upheaval, our prediction is for further increases nationally.
If that were to be coupled with a bright, long summer then
this could increase numbers further, increasing turnover
and ultimately profitability and value.
V I S I TOR ATTRACT IONS
F I V E K E Y T R E N D S S H OWN B Y 2 0 1 6 A N D
O U R P R E D I C T I O N S F O R 2 0 1 7
Source: Visit Britain statistics for Jan – Sept 2016